Note to the Instructor: This is the third in a series of four exercises that focus on the measurement of religious preference, religiosity, religious beliefs, and religious behavior. In these exercises we're going to analyze data from the Pew 2014 Religious Landscape Survey conducted by the Pew Research Center. We're going to use SPSS to analyze the data. A weight variable is automatically applied to the data set so it better represents the population from which the sample was selected. You have permission to use this exercise and to revise it to fit your needs. Please send a copy of any revision to the author so I can see how people are using the exercises. Please contact the author for additional information.
Goal of Exercise
The goal of this exercise is to provide an introduction to measurement which is an integral part of any research design. In this exercise we're going to focus on measuring religious beliefs. In the next exercise (Religion_4MR) we'll look at measuring religious behavior.
Part I—Concepts
We use concepts all the time. We all know what a book is. But when we use the word “book” we may not be talking about a particular book we’re reading. We could be talking about books in general. In other words, we’re talking about the concept to which we have given the name “book.” There are many different types of books – paperback, hardback, small, large, short, long, and so on. But they all have one thing in common – they all belong to the category “book.”
Let’s look at some other examples. Religious preference refers to the religion with which people identify. Some people say they are Lutheran; others say they are Roman Catholic; still others say they are Muslim; and others say they have no religious preference. Religiosity is another concept which refers to the degree of attachment that individuals have to their religious preference. It’s different than religious preference. Religiosity and religious preference are both concepts.
In other words, a concept is an abstract idea. There are the abstract ideas of book, religiosity, religious preference, and many others. Since concepts are abstract ideas and not directly observable, we must select measures or indicants of these concepts. We call this process measurement.
Part II – The Data Set We'll be Using
The Pew Research Center has conducted a number of surveys that deal with religion. Two of these surveys are the Religious Landscape Surveys conducted in 2007 and then repeated in 2014. They were very large telephone surveys of about 35,000 adults in the United States. For more information about the surveys, go to their website.
We'll be using a subset of the 2014 survey in this exercise which I have named Pew_2014_Religious_Landscape_ Survey_subset_for_classes.sav. For the purposes of these exercises I selected a subset of variables from the complete data set. I recoded some of the variables, created a few new variables, and renamed the variables to make them easier for students to use. There is a weight variable which should always be used so that the sample will better represent the population from which the sample was selected. To open the data set in SPSS, just double click on the file name.[1] Your instructor will tell you where the file is located.
Part III – Measuring Religious Beliefs – Belief in God
There is a wide variety of religious beliefs. In this exercise we'll focus on the following:
- belief in God,
- belief in heaven and hell,
- beliefs about the sacred books of a person's religion,
- complaints about religion, and
- positive views of religion.
In this part of the exercise, I'll show you how to analyze one of these beliefs and then you can practice on the others. Let's start with belief in God. The Pew survey asked, "Do you believe in God or a universal spirit?" This was followed by "How certain are you about this belief? Are you absolutely certain, fairly certain, not too certain, or not at all certain?" The names of these variables are RBL1 and RBL2.
Now that you have opened the data set, run a frequency distribution for variables RBL1 and RBL2. The variable name starts with the letters RBL which tells you that this variable describes religious beliefs. Some of you have used SPSS, the statistical package we're using, and know how to get a frequency distribution. Others of you are new to SPSS. There is a tutorial that you can use to learn how to get a frequency distribution. The tutorial is freely available on the Social Science Research and Instructional Center's website. Chapter 1 of the tutorial gives you a basic overview of SPSS and frequency distributions are covered in Chapter 4.
It's very easy to get frequency distributions. Once you have opened the data set in SPSS, look on the menu bar at the top and click on "Analyze." This will open a drop-down menu. Click on "Descriptive Statistics" and then on "Frequencies." You screen should look like Figure 1.
Figure 1
Notice that the list of all variables is in the pane on the left. I scrolled down to the variables that start with RBL. There are 21 of these variables but we're not going to look at all of them in this exercise. Select RBL1 and RBL2 by clicking on each one and then clicking on the arrow pointing to the right. This will move RBL1 and RBL2 into the "Variable(s)" box. Your screen should look like Figure 2.
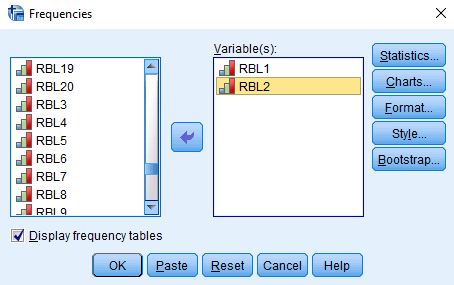
Figure 2
Now all you have to do is to click on "OK" to get your frequency distribution. Your screen should look like Figure 3.[2]
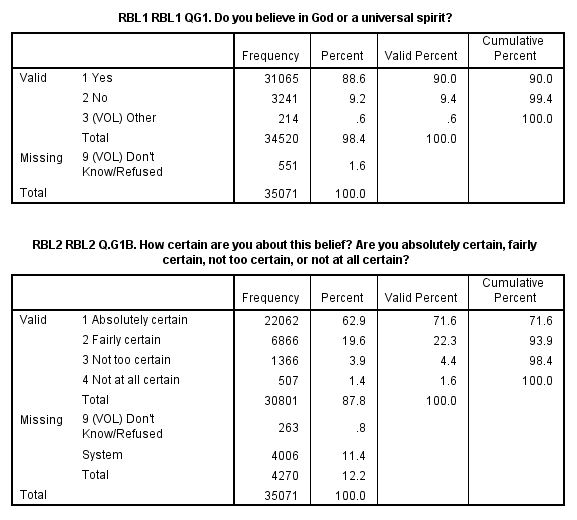
Figure 3
Take a few minutes to familiarize yourself with the information in the table.
- The first column is the value and the value label. The value "1" in the first table refers to all people who answered "Yes" – they believed in God.
- The second column is the number of respondents who said they believed in God (31,065).
- The third column converts the frequencies to percents. To compute the percent for those who answered "Yes" to RBL1, you would divide the frequency (31,065) by the total number of cases including those with missing values (35,071). Carry out the computation and convince yourself that it is 88.6%.
- The fourth column converts the frequencies to valid percents by dividing the frequency by the number of cases with valid information.
- Notice that in RBL1 some of the respondents said they didn't know if they believed in God and others refused to answer the question. This is what we refer to as missing data and they are coded "9." To compute the valid percent for those who answered "Yes," you would divide 31,065 by 34,520. In other words, it excludes the cases with missing information (551) from the denominator when computing the percent. Carry out the computation and convince yourself that it is 90.0%. This is called the valid percent. The more missing information there is in the distribution, the greater could be the difference between the percent and the valid percent. Normally we want to use the valid percents when describing the frequency distribution.
- For the second variable, RBL2, there are two types of missing data. Some said they didn't know or refused to answer the question and they are coded "9." But there's a second type of missing data that is labelled "System." What does that mean? The second question is a follow-up to the first question. It asks how certain respondents are about their belief in God. It wouldn't make any sense to ask this follow-up question to respondents who didn't answer "Yes" – they believed in God, to the first question. Anyone who answered anything other than "Yes" to the first question is assigned a system missing code for the second question. To verify this, add up the number of respondents who didn't answer "Yes" to the first question (i.e., 3,241 + 214 + 551) which equals 4,006. That's the number of respondents who are given the system missing code in the second question. So to get the valid percent for those who are absolutely certain there is a God, you would divide 22,062 by 30,801. In other words, you would exclude those with missing information (263 + 4,006 which equals 4,270[3]). Convince yourself that this equals 71.6%.
- The fifth column is the cumulative percent. The cumulative percent for the second category of RBL2 is 93.9%. In other words, 93.9% of the cases with valid information said they were either absolutely certain or fairly certain that there is a God. You can see where this comes from if you add up the valid percents for the first two categories of RBL2.
Part IV – Measuring Religious Beliefs – Belief in Heaven and Hell
Now were going to look at a different type of religious belief – whether or not respondents believe in heaven and hell. The Pew survey asked, "Do you think there is a heaven, where people who have lived good lives are eternally rewarded?" and "Do you believe there is a hell, where people who have lived bad lives are eternally punished?" These variables are named RBL4 and RBL5.
Run frequency distributions for these two questions and answer the following questions.
- How many respondents believe in a heaven? in a hell?
- What is the percent who believe in a heaven? in a hell?
- What is the valid percent who believe in a heaven? in a hell?
- Why aren't the percents and the valid percents the same?
- Do more people believe in a heaven or a hell? What is the difference between the two valid percents?
Part V – Measuring Religious Beliefs – Beliefs about the Sacred Books of a Person's Religion
This time let's look at beliefs about the sacred books of a person's religion. For example, for Christians that would be the Bible and for Muslims that would be the Koran (Quran). The Pew survey asked "Which comes closest to your view? Sacred text is the word of God OR sacred text is a book written by men and is not the word of God?" This is what is referred to as a forced-choice question. The respondent is asked to choose the response that comes closest to their own view. Notice that some respondents volunteered other responses (coded 3) and some said they didn't know or refused to answer (coded 9). Since there were so few respondents that gave another response, I defined this as a missing value along with those who said they didn’t know and refused to answer. Run a frequency distribution for RBL6 which is the name of this variable.
- What percent felt that that their sacred text was the word of God?[4]
- What percent felt that it was not the word of God?
This question was followed up by another question which asked, "And would you say? Sacred text is to be taken literally, word for word OR not everything in the sacred text should be taken literally, word for word?" For Christians, the sacred text is the Bible. Some Christians believe that the Bible is to be taken literally. For example, they would say that the first two chapters in Genesis (the first book in the Bible) describe literally how the world was created. This is basis for the disagreement over evolution and what should be taught in public schools (i.e., creationism or evolution). Run a frequency distribution for RBL7, the name of this variable.
- There are three missing data codes for this variable. Some respondents volunteered another answer (coded 3); some said they didn't know or refused to answer (coded 9); and others are coded system missing. How many are coded system missing?
- Now see if you can figure out where that number comes from. Look back at RBL6 and figure out which frequencies you have to add up to equal the number that are coded system missing.
- Now create your own frequency distribution which has the following categories.
- Sacred text is the word of God and is to be taken literally.
- Sacred text is the word of God and is not to be taken literally.
- Sacred text is not the word of God.
Part VI -- Measuring Religious Beliefs – Complaints about Religion
Interviews with members of different religious groups have shown that there are three common complaints about religion.
- They focus too much on rules (RBL15).
- They are too concerned with money and power (RBL16).
- They are too involved with politics (RBL17).
Run frequency distributions for these three variables. What percent of respondents agree with each of these complaints? Notice that for each of these variables respondents who said they didn't know or refused to answer were defined as missing data (coded 9).
One of the problems with this analysis is that we don't know whether these are isolated complaints or whether some respondents agree with more than one complaint. It would be interesting to know how many complaints each respondent agrees with. SPSS has a way to do this.
What we're going to do is to use the compute function in SPSS to count the number of complaints with which respondents agree. Click on "Transform" in the menu bar at the top of the SPSS screen. (See Chapter 3, Transforming Data, in the online SPSS book cited on page 1 of this exercise.) This will be in the second row at the top of the screen. Now click on "Compute Variable" in the drop-down menu and enter COMPLAINTS in the TARGET VARIABLE box. COMPLAINTS is the new variable we are going to compute and will be the number of complaints that respondents agree with. In the "Numeric Expression" box we're going to write the formula for the new variable COMPLAINTS. The variables in the data set are listed in the left-hand pane. Click on RBL15 and move it to the "Numeric Expression" box by clicking on the arrow pointing to the right just to the left of the box. Now click on the + sign. Go back to the list of variables and click on RBL16 and then on the arrow pointing to the right. Now click on the + sign again. Finally, go back to the list of variables and click on RBL17 and then on the arrow pointing to the right. Your formula should read RBL15 + RBL16 + RBL17. If you think it would be easier, you could manually enter this into the "Numeric Expression" box but be sure you don't make an error. Now click on OK at the bottom of the SPSS screen and SPSS will create the new variable. To see what it looks like, run a frequency distribution for COMPLAINTS.
- What percent agree with all three complaints? Note that "1" is the code for agree and "2" is the code for disagree. So you are summing up 1's and 2's.
- What percent disagree with all three complaints?
- Notice that there are a number of respondents with system missing codes. SPSS will code this new variable as system missing if it has missing data in any of the three variables that we sum. How many system missing cases are there and what percent is this of all the cases?
- What does all this tell you about complaints that respondents have about religion?
Part VII – Measuring Religious Beliefs – Positive Beliefs about Religion
The Pew survey didn't just ask about complaints about religion. They also asked about the positive contributions that religion makes to society. These include the following.
- They protect and strengthen morality in society (RBL18).
- They bring people together and strengthen community bonds (RBL19).
- They help the poor and needy (RBL20).
Use the compute function in SPSS to create a new variable called CONTRIBUTIONS which will be the sum of the three variables above. Then run a frequency distribution for CONTRIBUTIONS.
- What percent agree with all three contributions? Note that "1" is the code for agree and "2" is the code for disagree. So you are summing up 1's and 2's.\
- What percent disagree with all three contributions?
- Notice that there are a number of respondents with system missing codes. SPSS will code this new variable as system missing if it has missing data in any of the three variables that we sum. How many system missing cases are there and what percent is this of all the cases?
- What does all this tell you about the contributions that respondents think religion makes to society?
Part VIII – Conclusions
Write two or three paragraphs that summarize what you have learned about religious beliefs in the United States. Use the valid percents from the frequency distributions in your answer.
[1] This assumes that the proper associations have been set up on your computer so the computer knows that .sav files are SPSS data files
[2] SPSS allows you to change the way your output is displayed. You can change these preferences by clicking on "Edit" in the menu bar at the top of the screen and then clicking on "Options" and finally on the "Output" tab. Under "Variables in item labels shown as" select "Names and Labels" and then under "Variable values in item labels shown as" select "Values and Labels." Then click on "OK." You can also try out other options.
[3] There is a slight discrepancy here. When you add 263 and 4,006 you actually get 4,269 and not 4,270. You're off by one. That's due to the way the data are weighted and is nothing to worry about.
[4] Be sure to use the valid percents in answering these questions.

