Author: Ed Nelson
Department of Sociology M/S SS97
California State University, Fresno
Fresno, CA 93740
Email: ednelson@csufresno.edu
Notes to the Instructor: This is an appendix to the series of 13 exercises that were written for an introductory research methods class. The purpose of this appendix is to provide an introduction to SDA (Survey Documentation and Analysis). SDA is an online statistical package written by the Survey Methods Program at UC Berkeley and is available without cost wherever one has an internet connection. The first exercise in this series focuses on the research design which is your plan of action that explains how you will try to answer your research questions. Exercises two through four focus on sampling, measurement, and data collection. The fifth exercise discusses hypotheses and hypothesis testing. The last eight exercises focus on data analysis. In these exercises we’re going to analyze data from one of the Monitoring the Future Surveys (i.e., the 2017 survey of high school seniors in the United States). This data set is part of the collection at the Inter-university Consortium for Political and Social Research at the University of Michigan. The data are freely available to the public and you do not have to be a member of the Consortium to use the data. A weight variable is automatically applied to the data set so it better represents the population from which the sample was selected. You have permission to use this exercise and to revise it to fit your needs. Please send a copy of any revision to the author so I can see how people are using the exercises. Included with this exercise (as separate files) are more detailed notes to the instructors and the exercise itself. Please contact the author for additional information.
I’m attaching the following file:
· This page in MS Word (.docx) format.
Part I – Opening the Data Set
In these exercises we’re going to use the Monitoring the Future (MTF) Surveys of high school seniors in the United States that have been conducted yearly since 1975. There is a website that will give you a lot of information about this study. Here’s a brief description from the website’s home page.
“Monitoring the Future is an ongoing study of the behaviors, attitudes, and values of American secondary school students, college students, and young adults. Each year, a total of approximately 50,000 8th, 10th and 12th grade students are surveyed (12th graders since 1975, and 8th and 10th graders since 1991). In addition, annual follow-up questionnaires are mailed to a sample of each graduating class for a number of years after their initial participation."
Information about these surveys is archived at the Inter-university Consortium for Political and Social Research (ICPSR) located at the University of Michigan. Start by going to their website. In the upper-right corner of the home page click on “Log In/Create Account.” Scroll down and click on “Create Account” below “New User.” Fill in the requested information and click on “Submit.” It will create your account and give you access to the ICPSR archive. You can use your account from anywhere you have internet access. If you don’t use your account for six months, your account will go away. All accounts are free.
If you are a student, faculty member or staff at a university or college that belongs to the ICPSR, you will have access to all the archive’s data holdings. If you are not, then you will only have access to public-use data. Fortunately, the MTF Surveys were funded for public access so you have access to this study regardless of your status.
Once you have created your account, click on “Find Data” in the menu bar at the top of the screen. Then type “ICPSR 37182” in the “Find Data” box and you will see the 2017 12th grade survey which is what we are using in these exercises. Click on the link to the survey which will take you to the home page for this survey. Scroll down a little and you will see two links - one for downloading the data and the other for analyzing the data online. Click on "Analyze Online" and then on "Full Analysis Capabilities."
We’re going to use SDA (Survey Documentation and Analysis) to analyze the data which is an online statistical package written by the Survey Methods Program at UC Berkeley and is available without cost wherever one has an internet connection. You'll have to log in using the user name and password for the ICPSR account you just created. You should see the “Terms of Use” which is a legal agreement you need to agree to in order to use the data. Read it and then click on “I agree.” You should see Figure 1 on your screen.
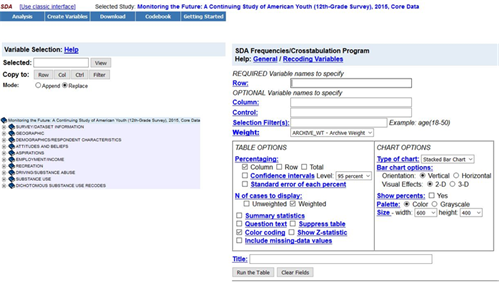
Figure 1
Part II – SDA Dialog Box
Figure 1 shows you the SDA dialog box which is your interface to SDA. Let’s spend a little time exploring the dialog box.
- In the very top line is the name of the data set you opened. Always check to make sure you opened the correct data set. It should say that you have opened the Monitoring the Future 12th- Grade Survey, 2017, Core Data.
- Below that you will see five buttons – Analysis, Create Variables, Download, Codebook, and Getting Started.
- Getting started has more information than your students will need.. This introduction to SDA should provide enough information.
- Codebook has information about the variables in this data set and documentation for the survey.
- On the left you should see a list of all the variables in the core data set. The variables are grouped in the following categories.
- Survey/Dataset information which includes the weight variable
- Geographic which provides information about where they live
- Demographic variables describing both the respondent and the respondent’s family
- Attitudes and beliefs about politics, religion, and school
- Educational and military aspirations
- Employment and income
- Recreational information
- Driving and substance abuse
- Substance use
- Substance use variables recoded into dichotomies
Part III – Carrying Out the Statistical Analysis
To see the statistical procedures you can use to analyze the data, click on “Analysis” at the top of the page. We’re only using frequencies and crosstabulation in these exercises which is the default (see Figure 1 above). We’re going to use frequencies as an example in this introduction.
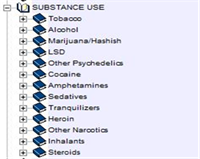
Notice that there is a mini-codebook on the left-side of the screen. What you see is the categories of variables in the core data set (see above). Click on the “+” sign to the left of one of the categories, for example, “Substance Use." This will expand the codebook and show you all the subcategories of this category. You can also double-click on the category to expand it. Your screen should look like Figure 2.
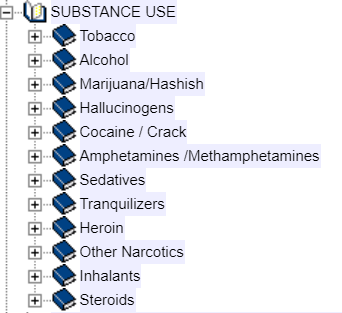
Figure 2
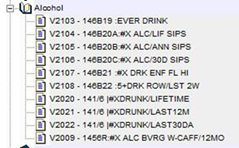
The second subcategory is “Alcohol.” Click on the “+” sign to the left of Alcohol. Your screen should look like Figure 3.
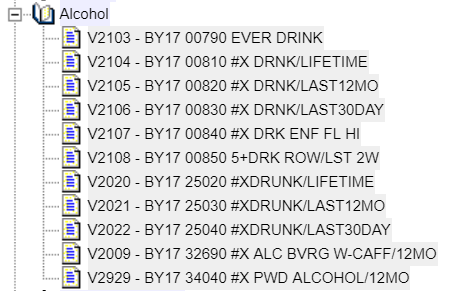
Figure 3
The variable names are on the far left, for example, V2103. To the right of the variable name is the variable label. Click on V2103. The variable now appears in the “Variable Selection” box at the top of the screen. Your screen should look like Figure 4.
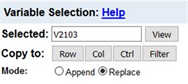
Figure 4
Click on the “View” button to the right of the variable name and you will see the wording of question, the frequency distribution, and the values that have been designated as missing values. Close the View tab and you should see Figure 4 again. Now click on “Row” to the right of “Copy to” and the variable name will be entered in the “Row” box. Your screen should look like Figure 5. You could also have typed V2103 in the box. Either way works.
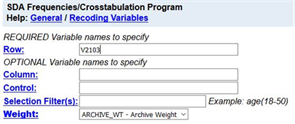
Figure 5
Click on “Run the Table” at the bottom of the page to get the frequency distribution for V2103. Your screen should look like Figure 6.
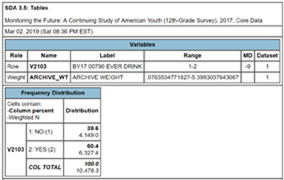
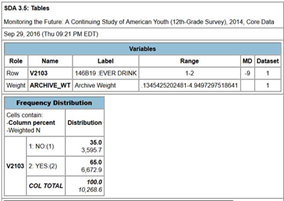
Figure 6
The table shows that 60.45% of high school seniors said they had an alcoholic drink while 39.6% said they didn’t.
You can copy and paste the tables from the SDA output into your paper. Or you could create a screen capture using an application like Snipping Tool.
Instructions for further use of SDA will be included in the exercises of this module.

