Note to the Instructor: This is the fourth in a series of four exercises that focus on the measurement of religious preference, religiosity, religious beliefs, and religious behavior. In these exercises we're going to analyze data from the Pew 2014 Religious Landscape Survey conducted by the Pew Research Center. We're going to use SPSS to analyze the data. A weight variable is automatically applied to the data set so it better represents the population from which the sample was selected. You have permission to use this exercise and to revise it to fit your needs. Please send a copy of any revision to the author so I can see how people are using the exercises. Please contact the author for additional information.
Goal of Exercise
The goal of this exercise is to provide an introduction to measurement which is an integral part of any research design. In this exercise we're going to focus on measuring religious behavior.
Part I—Concepts
We use concepts all the time. We all know what a book is. But when we use the word “book” we may not be talking about a particular book we’re reading. We could be talking about books in general. In other words, we’re talking about the concept to which we have given the name “book.” There are many different types of books – paperback, hardback, small, large, short, long, and so on. But they all have one thing in common – they all belong to the category “book.”
Let’s look at some other examples. Religious preference refers to the religion with which people identify. Some people say they are Lutheran; others say they are Roman Catholic; still others say they are Muslim; and others say they have no religious preference. Religiosity is another concept which refers to the degree of attachment that individuals have to their religious preference. It’s different than religious preference. Religiosity and religious preference are both concepts.
In other words, a concept is an abstract idea. There are the abstract ideas of book, religiosity, religious preference, and many others. Since concepts are abstract ideas and not directly observable, we must select measures or indicants of these concepts. We call this process measurement.
Part II – The Data Set We'll be Using
The Pew Research Center has conducted a number of surveys that deal with religion. Two of these surveys are the Religious Landscape Surveys conducted in 2007 and then repeated in 2014. They were very large telephone surveys of about 35,000 adults in the United States. For more information about the surveys, go to their website.
We'll be using a subset of the 2014 survey in this exercise which I have named Pew_2014_Religious_Landscape_ Survey_subset_for_classes.sav. For the purposes of these exercises I selected a subset of variables from the complete data set. I recoded some of the variables, created a few new variables, and renamed the variables to make them easier for students to use. There is a weight variable which should always be used so that the sample will better represent the population from which the sample was selected. To open the data set in SPSS, just double click on the file name.[1] Your instructor will tell you where the file is located.
Part III – Measuring Religious Behavior – Participation in Religious Groups
There are many different types of religious behavior. In this exercise we'll focus on the following:
- participating in prayer, scripture study, or religious education groups (RBH1),
- reading scripture outside of religious services (RBH2),
- sharing one's faith with non-believers or people from other religious backgrounds (RBH5),
- doing volunteer work as part of one's church or religious organization (RBH7), and
- sharing one's faith with their children (RBH8, RBH9, and RBH10).
In the first part of the exercise, I'll show you how to analyze one type of religious behavior then you can practice on the others. Let's start with participation in different types of religious groups. The Pew survey asked, "How often do you…participate in prayer groups, scripture study groups or religious education programs?" The name of this variable is RBH1.
Now that you have opened the data set, run a frequency distribution for the variable RBH1. The variable name starts with the letters RBH which tells you that this variable describes religious behavior. Some of you have used SPSS, the statistical package we're using, and know how to get a frequency distribution. Others of you are new to SPSS. There is a tutorial that you can use to learn how to get a frequency distribution. The tutorial is freely available on the Social Science Research and Instructional Center's website. Chapter 1 of the tutorial gives you a basic overview of SPSS and frequency distributions are covered in Chapter 4.
It's very easy to get frequency distributions. Once you have opened the data set in SPSS, look on the menu bar at the top and click on "Analyze." This will open a drop-down menu. Click on "Descriptive Statistics" and then on "Frequencies." You screen should look like Figure 1.
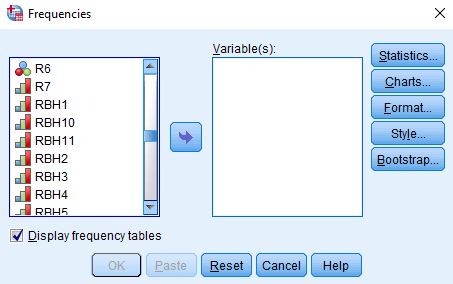
Figure 1
Notice that the list of all variables is in the pane on the left. I scrolled down to the variables that start with RBH. There are 11 of these variables but we're not going to look at all of them in this exercise. Select RBH1 by clicking on the variable name and then clicking on the arrow pointing to the right. This will move RBH1 into the "Variable(s)" box. Your screen should look like Figure 2.
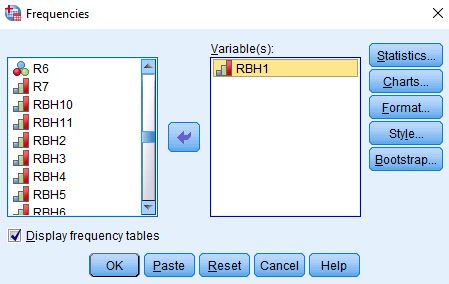
Figure 2
Now all you have to do is to click on "OK" to get your frequency distribution. Your screen should look like Figure 3.[2]
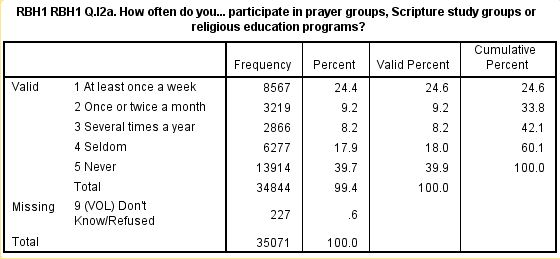
Figure 3
Take a few minutes to familiarize yourself with the information in the table.
- The first column is the value and the value label. The value "1" in the first table refers to all people who said they participated at least once a week.
- The second column is the number of respondents who said they participated at least once a week (8,567).
- The third column converts the frequencies to percents. To compute the percent for those who participated at least once a week, you would divide the frequency (8,567) by the total number of cases including those with missing values (35,071). Carry out the computation and convince yourself that it is 24.4%.
- The fourth column converts the frequencies to valid percents by dividing the frequency by the number of cases with valid information. There is one missing value code for this variable. Those who said they didn't know or refused to answer (227) which were coded "9." To compute the valid percent for those who answered at least once a week, you would divide 8,567 by 34,844. In other words, it excludes the cases with missing information (227) from the denominator when computing the percent. Carry out the computation and convince yourself that it is 24.6%. This is called the valid percent. The more missing information there is in the distribution, the greater could be the difference between the percent and the valid percent. Normally we want to use the valid percents when describing the frequency distribution.
- The fifth column is the cumulative percent. The cumulative percent for the second category of RBH1 is 33.8%. In other words, 33.8% of the cases with valid information said they participated in this type of religious groups at least once or twice a month. You can see where this comes from if you add up the valid percents for the first two categories of RBH1.
Part IV – Measuring Religious Behavior – Reading Scripture
Now were going to look at a different type of religious behavior – reading scripture. The Pew survey asked, "How often do you…read scripture outside of religious services?" This variable is named RBH2.
Run a frequency distribution for RBH2 and answer the following questions.
- How many respondents read scripture once or twice a month?
- What is the percent who read scripture once or twice a month?
- What is the valid percent who read scripture once or twice a month?
- Why aren't the percents and the valid percents the same?
- What is the percent who read scripture at least once or twice a month?
Part V – Measuring Religious Behavior – Sharing One's Faith
This time let's look at behavior that involves sharing one's faith with others. The Pew survey asked, "How often do you …share your faith with non-believers or people from other religious backgrounds?" The name of this variable is RBH5. Run a frequency distribution for RBH5.
Notice that this variable has two types of missing data. Some respondents said they didn't know or refused to answer the question and are coded "9." Other respondents are given a code of "system missing". To see what system missing means, run a frequency distribution for R5 which is one of the variables that describes religious preference. You'll see that there are 8,005 respondents who said they had no religious preference and 225 that said they didn't know or refused to answer the question on religious preference. If you add these two numbers, you get 8,229 which is the number of "system missing" values in RBH5. In other words, RBH5 wasn't asked of respondents who didn't give a religious preference to the earlier question. They are given a "system missing" code.
Using the information from the frequency distribution for RBH5, answer the following questions.
- What percent said they shared their faith at least once a week?[3]
- What percent said they shared their faith once or twice a month?
- What percent said they shared their faith at least once or twice a month?
- What percent said they never shared their faith?
- What does this tell you about the willingness of those with a religious preference to share their faith?
Part VI -- Measuring Religious Behavior – Performing Volunteer Work for a Church or Religious Organization
Churches are typically volunteer organizations. They depend on volunteers to carry out their work. The Pew survey asked, "Thinking specifically about just the past week, that is the past seven days – did you yourself happen to do any volunteer work in the last seven days, or not?" If they responded that they did, they were asked if this volunteer work was done mainly through church or other religious organizations or if it was done mainly through non-religious organizations. Some respondents volunteered that it was done through both. Run a frequency distribution for this variable which is named RBH7.
- What percent volunteered at all?
- What percent of all respondents did volunteer work though a religious organization? Note that those who did volunteer work through both a religious organization and in other ways should also be counted as having volunteered through a religious organization.
- What percent of those who did volunteer work did that work through a religious organization?
- What percent did not volunteer at all?
Part VII – Measuring Religious Behavior – Activities With Children
The Pew survey also asked about activities that the respondent did with their children under the age of 18. The question started "Please tell me if you do any of the following with [your child/any of your children]." The question included three different types of religious activities:
- Praying or reading scripture with children (RBH8).
- Sending children to Sunday school or another religious education program (RBH9).
- Home schooling or sending children to a religious school instead of a public school (RBH10).
Respondents answered yes (1) or no (2) to each of these three questions.
Run a frequency distribution for these three variables. It important to note that these questions were only asked of respondents who currently had a child under the age of 18 living at home.
We're going to start by selecting out respondents who answered all three questions. Click on "Data" in the menu bar at the top of the SPSS screen. This will be the second row at the top of the screen. Now click on "Select Cases" in the drop-down menu and select "If condition is specified" in the option on the right. (See Chapter 3, Transforming Data, in the online SPSS book cited on page 1 of this exercise.) Now click on the blue button just below this option. Copy the following statement and paste it into the box to the right of the arrow.
RBH8 <= 2 & RBH9 <= 2 & RBH10 <= 2
This statement tells SPSS to select out only those cases for which the respondents choose the yes (1) or the no (2) response for all three variables. Click on "Continue" and then on "OK."
Now that we have selected out the cases for which there was a valid response to all three questions, let's count the number of times the respondent said they engaged in these activities with their children. Click on "Transform" in the menu bar at the top of the SPSS screen. This will be the second row at the top of the screen. Now click on "Count Values within Cases" in the drop-down menu and enter ACTIVITIES_WITH_CHILDREN in the "Target Variable" box. Then select RBH8 and RBH9 and RBH10 and move them to the "Numeric Expression" box by clicking on each variable and then clicking on the arrow pointing to the right which is just to the left of the box. Now click on the "Define Values" button just below this box. Enter the value "1" in the "Value" box and then click on the "Add" button to move the value to the big box on the right. Finally, click on "Continue" and then on "OK." This will create a new variable that is the number of activities that respondents engaged in with their children.
Run a frequency distribution for the variable you just created and answer the following questions.
- What percent of respondents engaged in none of these activities with their children?
- What percent of respondents engaged in all three of these activities with their children?
- What percent of respondents engaged in two or more of these activities with their children?
- What is the total number of cases in these tables? Explain which cases are included in this total.
Part VIII – Conclusions
Write two or three paragraphs that summarize what you have learned about religious behavior in the United States. Use the valid percents from the frequency distributions in your answer.
[1] This assumes that the proper associations have been set up on your computer so the computer knows that .sav files are SPSS data files
[2] SPSS allows you to change the way your output is displayed. You can change these preferences by clicking on "Edit" in the menu bar at the top of the screen and then clicking on "Options" and finally on the "Output" tab. Under "Variables in item labels shown as" select "Names and Labels" and then under "Variable values in item labels shown as" select "Values and Labels." Then click on "OK." You can also try out other options.
[3] Be sure to use the valid percents in answering these questions.

